Event Analytics in Singapore: Improve Campaign Performance
30 December 2025
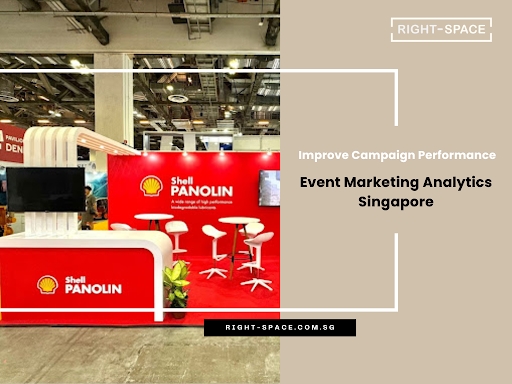
Event marketing analytics in Singapore has shifted from guesswork to evidence-based decision-making. Brands now rely on behavioural data, real-time tracking and attribution frameworks to understand how people move, react and convert at events. This blog will walk you through how Singapore teams use analytics to improve campaign performance across physical activations, exhibitions and hybrid experiences.
Modern event teams often work with integrated service frameworks such as the events and marketing solutions outlined on the events and marketing page to align creative direction with measurable performance outcomes.
1. Why Data Is the New Creative Partner in Event Marketing
Brands used to plan events around visual appeal and hope for engagement. Today, teams combine creativity with data streams that show how people behave on the ground. Event analytics dashboards help marketers track movement patterns, dwell time, engagement feedback and conversion intent. This shift changed how events are designed because teams can see which zones work and which do not.
A global engagement study published by Event Marketer in 2024 showed that brands using structured data loops were more likely to hit their event KPIs than brands relying only on qualitative observations. The implication is clear. Creativity shapes interest but data shapes performance.
Singapore companies apply this principle across exhibitions, roadshows and brand activations. Insights gathered from events influence future campaign planning, budget allocation and spatial design.
2. What Metrics Matter Most When Measuring Engagement
Event KPI tracking varies by campaign type, but several metrics consistently determine how well an activation performs. These KPIs help teams understand which aspects of the experience resonate with Singapore audiences.
Footfall and flow
Footfall analytics tools show how many visitors enter the zone and how they move through it. A high entry rate but low progression rate may signal that the entry point is unclear or the first interaction is not strong enough.
Dwell time
Dwell time measurement reveals how long people remain inside a particular zone. Longer dwell time suggests stronger emotional or experiential value. Short dwell time signals that the experience does not invite deeper exploration.
Engagement actions
Engagement rate metrics track interactions such as button triggers, sensor activations, AR elements or touchscreen usage. These signals help brands see which features hold attention.
Lead capture signals
On-site lead capture analytics measure form submissions, QR scans, demo requests or sample collections. Some brands map these signals into event funnel conversion data to track how visitor engagement translates into marketing qualified leads.
Understanding these patterns supports the development of more precise creative briefs and informs how production teams shape spatial design.
3. How Real-Time Tracking Helps Brands React Faster
Real-time event tracking allows Singapore brands to adjust campaigns while they are still running. This matters because audience behaviour often shifts depending on weather, time of day or crowd density.
Heatmap behaviour
Visitor heatmap analysis shows hotspots where people slow down, cluster or avoid. If a cluster forms unexpectedly, staff may choose to expand the space or redirect flow to reduce congestion.
Live interaction metrics
Live tap, swipe or trigger counts signal which installations perform well. Teams can make adjustments in real time such as increasing staff presence near popular features or repositioning underperforming elements.
Traffic bottleneck prevention
When pathways become congested, planners can adjust queue lines or reposition props to optimise movement flow.
Real-time data is not used only for troubleshooting. It improves visitor satisfaction, which in turn increases the engagement-to-lead ratio across the entire activation.
4. Why Attribution Matters in Event Campaign ROI
Event attribution modelling helps brands understand which touchpoints contribute to conversions. Without attribution, teams assume all engagement is equal. With attribution, marketers see which actions create real value.
Attribution frameworks applied in Singapore often include:
Multi-touch event attribution
This model credits several touchpoints such as entry interaction, mid-zone activity and final CTA participation. It reflects the reality of experiential behaviour patterns where people interact multiple times before taking action.
QR-driven attribution
QR code engagement tracking allows teams to see exactly which zones generate the most scans. When each QR code is uniquely tagged, marketers can map engagement to specific installations.
Content attribution
Some teams track which installations produce the most user-generated content. Social engagement becomes a performance indicator that aligns with event virality factors.
A study by Think with Google on decision journeys and attribution highlighted how behavioural signals strengthen campaign accuracy when measuring ROI across physical touchpoints. The same principle applies to exhibitions and roadshows in Singapore.
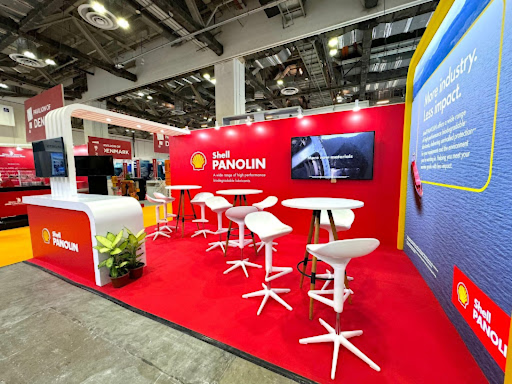
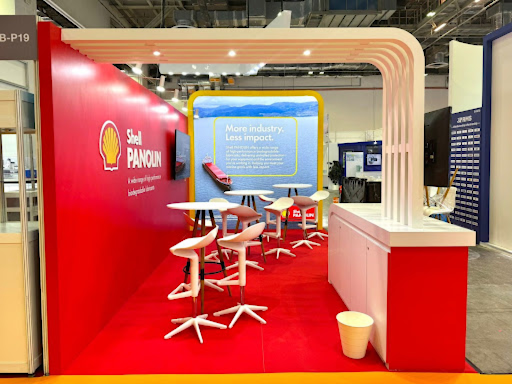
5. How Singapore Brands Use Data to Optimise Event Space and Flow
Behavioural data insights at exhibitions are particularly important for companies participating in trade shows or large public activations. Space is expensive, and understanding how people move through it directly impacts booth performance metrics.
Entry point optimisation
Brands analyse footfall to determine which entrances draw the most attention. High performing booths often place their hero installation where the first flow line naturally converges.
This mirrors strategies found in Maximizing ROI With an Event Booth Design Company, which explains how strategic placement influences visibility and interaction.
Zone performance comparison
Teams compare performance between zones such as demo areas, product showcases or photo points. If one zone consistently underperforms, planners refine content placement or sensory cues.
Lead-flow sequencing
When lead capture happens too early or too late in the visitor journey, conversions drop. Analytics highlight the best timing for interaction prompts.
Staffing allocation
Heatmap behaviour shows where staff should be placed to assist visitors or manage crowd areas. This improves both experience quality and conversion efficiency.
6. Event Funnels and Conversion Metrics Tell a Different Story
Traditional marketing funnels do not always translate to live environments. Event funnels are shaped by physical movement, sensory input and interactive behaviour.
An effective event funnel captures data across these points.
Awareness signals
Entry counts, first impressions and early engagement metrics.
Interaction signals
Touch interactions, AR engagement, content consumption or hands-on demos.
Intent signals
Form interest, demo requests, QR scans or verbal enquiries.
Conversion signals
Confirmed leads, signups, or post-event follow-ups.
Event funnel conversion data helps brands pinpoint where visitors lose interest. These drop-off points are often opportunities for redesign, stronger staff presence or improved CTAs.
7. UTM Tracking and Campaign Integration Improve Marketing ROI
Events rarely exist in isolation. They often connect to digital campaigns. UTM tracking for events shows how visitors interact with post-event content, product pages, or follow-up communication.
Singapore brands often use UTMs in:
QR codes
Each QR code leads to a UTM-tagged landing page that shows the origin of engagement.
Email follow-ups
UTMs help identify which event visitors reengage with content after the activation ends.
Paid media retargeting
Visitors who engage deeply may be added to remarketing audiences.
Post-event performance reports connect these insights to the overall marketing mix, helping brands understand how physical experience contributes to digital conversion behaviour.
8. How Singapore’s Regulations Shape Event Data Practices
Singapore event data compliance requires brands to manage personal information responsibly. Event marketers often adopt the following approaches.
Clear data collection notices
Visitors are informed when their data is being collected, especially for contests or digital check-ins.
Minimal data approaches
Teams collect only what they need for attribution or lead qualification.
Secure storage of analytics data
Brands use secure dashboards and encrypted databases for event KPI tracking.
Compliance helps build trust and supports long-term brand reputation.
9. Creating a Continuous Optimization Loop
Data-driven event marketing does not end when the activation closes. Singapore teams apply a continuous improvement loop.
Review
Teams evaluate heatmaps, funnel metrics and onsite engagement.
Interpret
Insights guide decisions about layout, messaging or sensory cues.
Adjust
Future activations incorporate improvements to raise engagement and conversion.
Validate
New data validates whether the changes created a measurable improvement.
This cycle reflects the principle of campaign optimization loops that many high-performing Singapore brands rely on.
Conclusion
Data-driven event marketing is no longer optional for brands that want meaningful engagement. When teams combine behavioural insights, tracking tools, and attribution models, event design becomes more intentional, and performance becomes more predictable. Singapore’s tech-ready audiences and structured environments make the market ideal for measurable, insight-driven experiential campaigns that improve with every iteration. Working with partners who understand both creative design and analytics can help brands turn each activation into a smarter and more effective one.
If your brand is exploring how to apply data, behavioural insights or real-time tracking to upcoming activations, the Right-Space team can help translate these signals into stronger engagement and clear campaign outcomes.
FAQs About Event Marketing Analytics Singapore
What metrics should Singapore brands focus on when measuring event performance?
Brands often start with footfall analytics, dwell time and interaction counts. These metrics reveal how visitors behave in physical environments and help refine future layouts and messaging.
How does QR code tracking support event attribution?
QR codes tagged with UTM parameters show which zones generate meaningful engagement. This helps teams understand intent signals, especially when mapped against post event digital activity.
Why is dwell time important in experiential marketing?
Dwell time reflects emotional and experiential quality. Longer dwell time usually indicates stronger sensory engagement or clearer narrative flow, both of which influence lead generation.
How do Singapore brands ensure analytics comply with data protection rules?
Brands follow Singapore event data compliance guidelines by minimising collection, using secure storage and clearly informing visitors when their data is being captured.
What is the benefit of post event performance reports?
Post event reports show which zones contributed most to conversions, helping marketers focus creative and budget resources where they matter most.